
The factor zoo
The academic literature on return anomalies - also known as factor strategies or smart beta - is very extensive. It all started with the market factor (beta) in the CAPM and its extension by the classical factors size and value to the Fama/French 3-factor model. Since then, research into factors has increasingly gathered pace. Hundreds of them are now known.
Combinations without end
This is where the study "Interacting Anomalies" by Karsten Müller and Simon Schmickler comes in. They write that in addition to the factors, various interactions between them were also investigated. Methodically, combined "double sorts" are created - the considered stock universe is thus sorted according to two factors. This results in thousands of possible combinations, which further exacerbates the data mining problem that already exists with the actual factors.
The following chart compares the methods for constructing combined factors. In the unconditional case, for example, shares are assigned to the high-high portfolio (HH) if they belong to the top 20 percent in both factors (other corner portfolios analogously). The disadvantage: some portfolios contain few or no stocks. In the conditional case, the sorting is sequential. Here, the final portfolios contain the same number of stocks and are more comparable. The central results of the study are based on conditional portfolios.
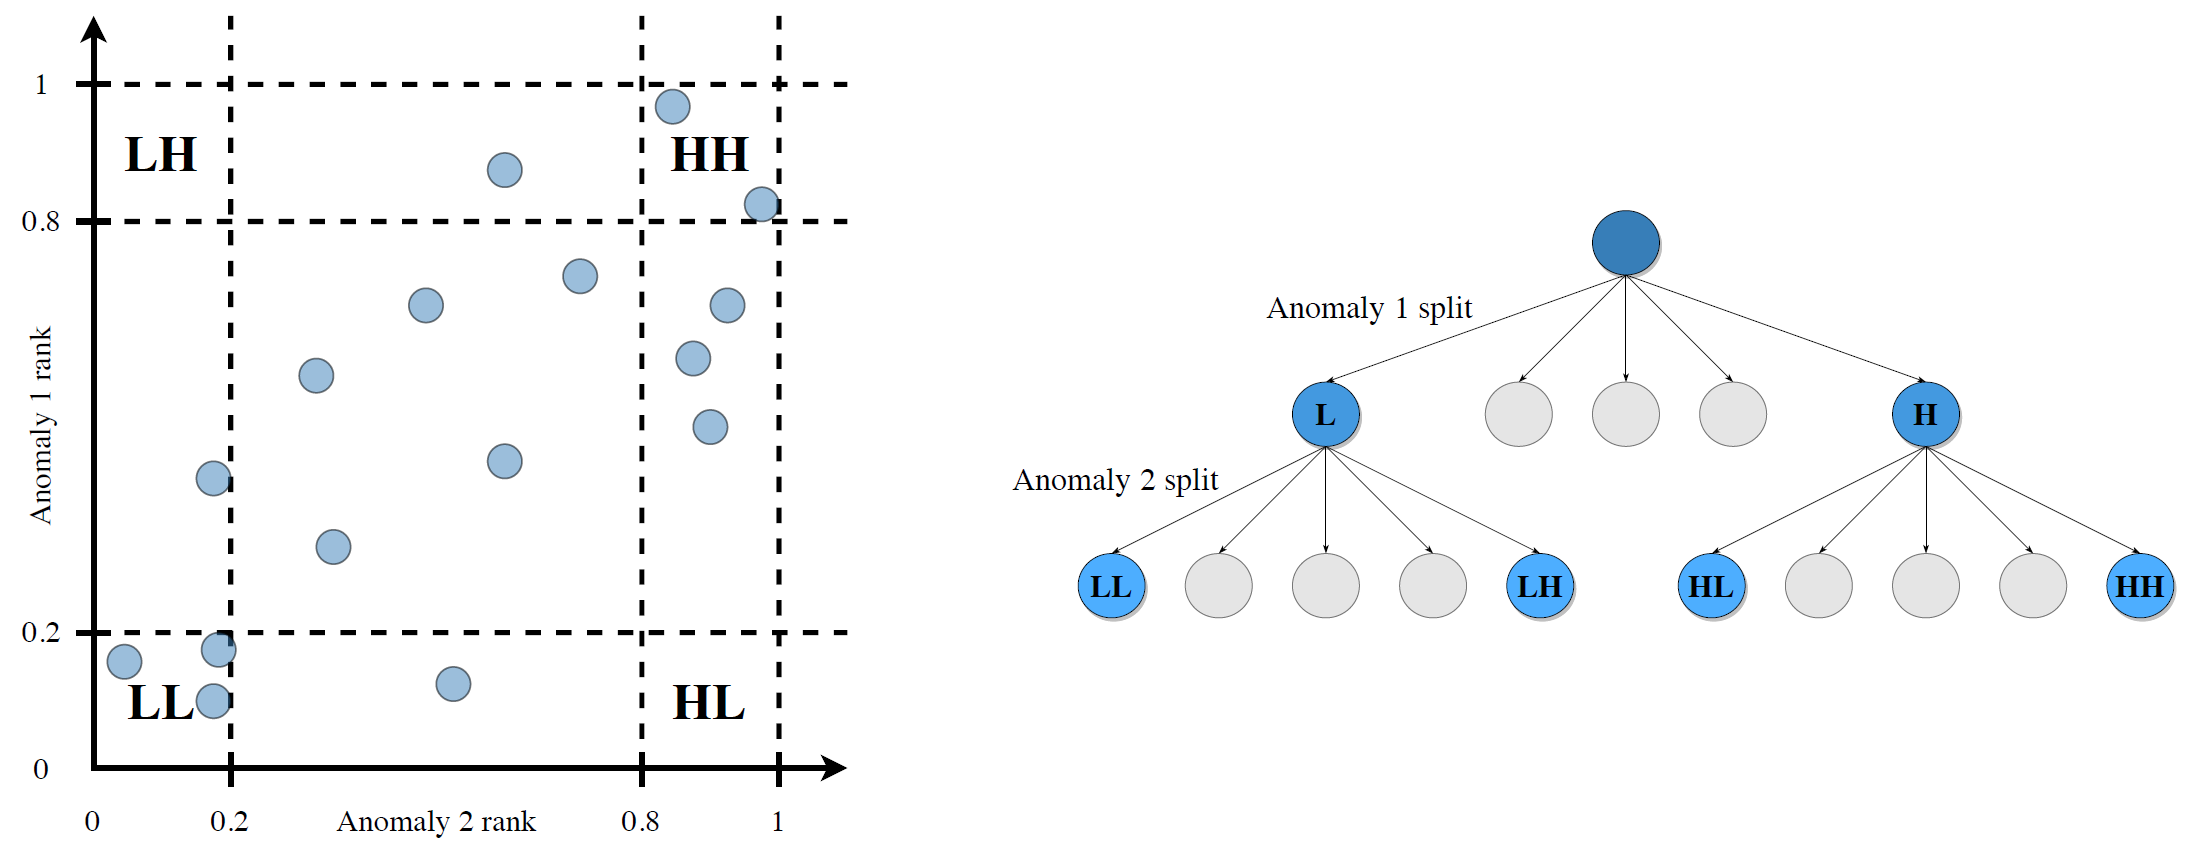
Source: Müller, K. / Schmickler, S. (2020), Interacting Anomalies, p. 31
Interaction gains
The authors conduct a comprehensive examination of all double-sort strategies resulting from the factors considered: 102 x (102 - 1) = 10,302 combinations. The data mining problem is taken into account, as appropriately adjusted significance levels are used in multiple hypothesis testing (Bonferroni correction). Despite this much higher hurdle, hundreds of combinations achieve statistically significant excess returns. These are called interaction gains, and the corresponding interactions can be visualised by network graphs.
The following figure shows which factors interact particularly with others by analysing equally weighted portfolios. The links show interactions with statistically significant gains, with the degree of red colouring indicating its magnitude. Period studied: 1970 to 2017.
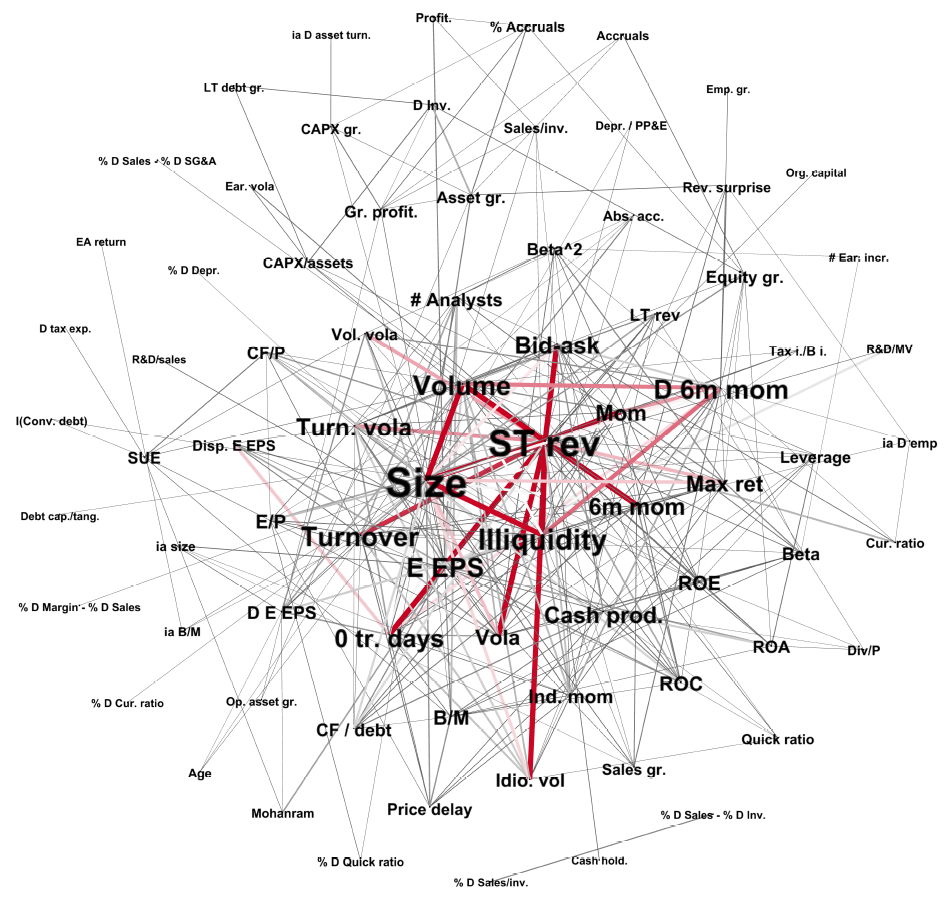
Source: Müller, K. / Schmickler, S. (2020), Interacting Anomalies, p. 33
The best effects
The study shows that two types of characteristics in particular led to statistically significant interaction gains with other factors:
Past returns (especially short-term reversal).
Limits to arbitrage (especially size)
The best individual strategy combines the factors short-term reversal and illiquidity. According to the authors, the particularly good combinations generally have a high portfolio turnover (e.g. short-term reversal) and high trading costs (e.g. illiquidity).
It is interesting to note that the returns of the corresponding strategies are particularly high in bad market phases, which are characterised by high illiquidity and volatility as well as poor sentiment. Apparently, therefore, the returns also persisted because the corresponding factors were difficult to arbitrage.
This is matched by the fact that the best combinations have lost profitability since the early 2000s. This is shown in the following chart based on the share of long-short strategies (equally weighted portfolios) with statistically significant interaction gains. These are shown rolling over ten years at the 1-, 5- and 10-percent level. Period studied: 1988 to 2017. The decline can be explained, for example, by advances in financial technology and lower trading costs as a result of decimalisation.
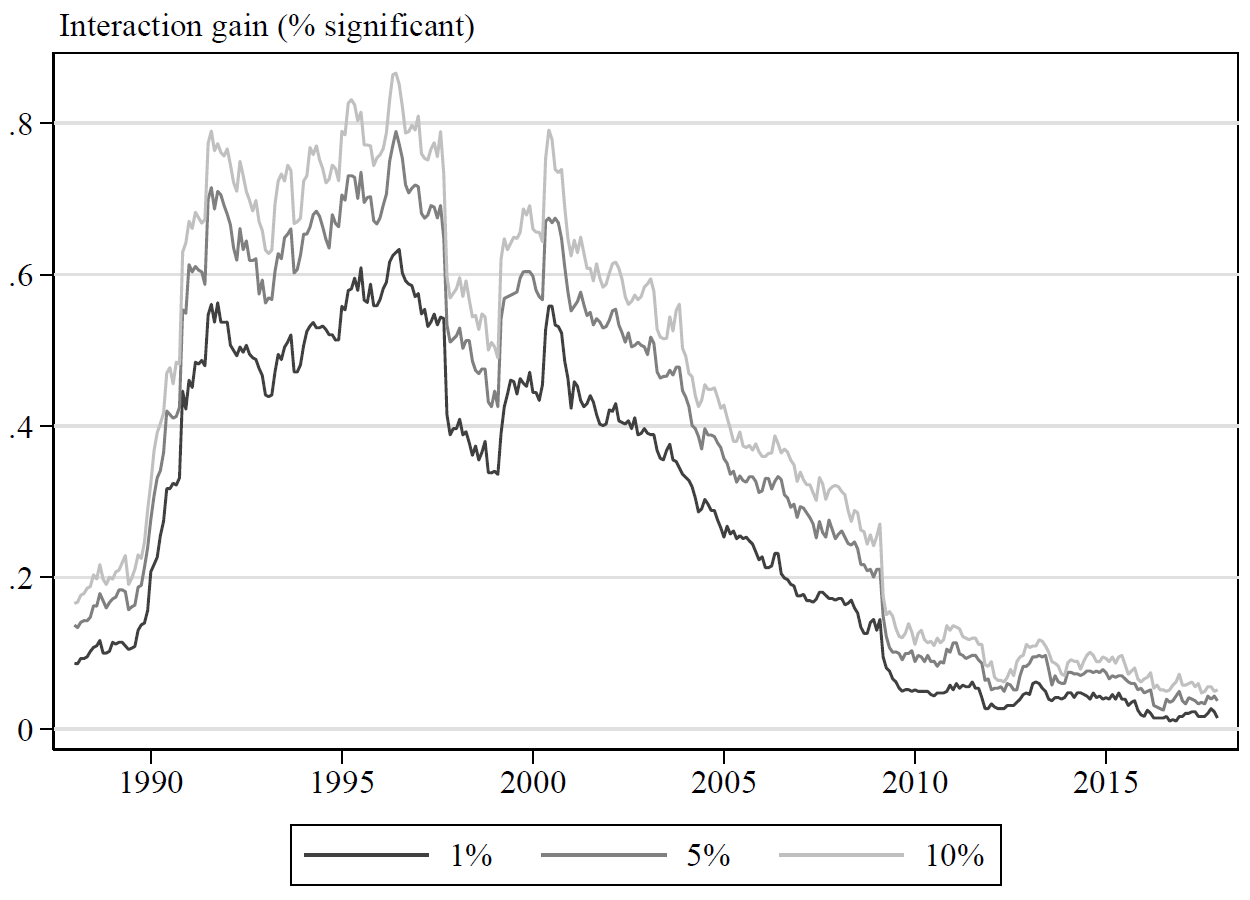
Source: Müller, K. / Schmickler, S. (2020), Interacting Anomalies, p. 35
Let us now turn to perhaps the most interesting point of the study, which was already mentioned at the beginning.
Benchmark for Machine Learning
The study authors write that many combined strategies have average returns comparable to those of current machine learning approaches that use similar data and variables. This is probably no coincidence. The researchers suggest that the complex approaches achieve their results largely based on simple combinations of different characteristics. In fact, the study finds an almost perfect match between the best factor interactions and the most important variables for return predictions in machine learning models according to relevant studies.
It follows that the factor interactions identified can be used as the basis for a benchmark against which machine learning strategies can be measured. The excess returns identified in the study can be achieved comparatively easily by sorting stocks in a transparent manner. The "black boxes", on the other hand, would have to perform much better to justify their disadvantage in transparency.
Conclusion
The best factor interactions show surprising parallels to certain machine learning strategies. One might think that a benchmark derived from this does not bode well for these algorithms. But the authors' conclusion is quite positive: They look at it from the perspective of potential and write that there should still be considerable room for progress in the application of machine learning.


