Share this Article & Support our Mission Alpha for Impact
This is some text inside of a div block.

Sharpe vs. Sortino: choosing the right reward/risk metric for your strategies.

Post by 
Text Link
Performance in terms of raw profit does not reveal all the aspects of a trading system and it is certainly not the best way to appraise it. The risk of the underlying strategy has to be regarded too. A very popular gauge, which describes the relation between return and risk is the Sharpe Ratio. This article first describes the Sharpe Ratio and its drawbacks. Subsequently the Sortino Ratio is presented. Last but not least you will learn which of the two common gauges best reflects the system’s reward/risk.

THE SHARPE RATIO

Originated in 1966 by William F. Sharpe as a performance gauge for mutual funds the Sharpe Ratio is nowadays the industry standard for the evaluation and optimization of investments and trading systems. The formula is the excess return in relation to the standard deviation and describes the reward/risk of the underlying investment:

formula for Sharpe Ratio
Figure 1) Sharpe Ratio formula

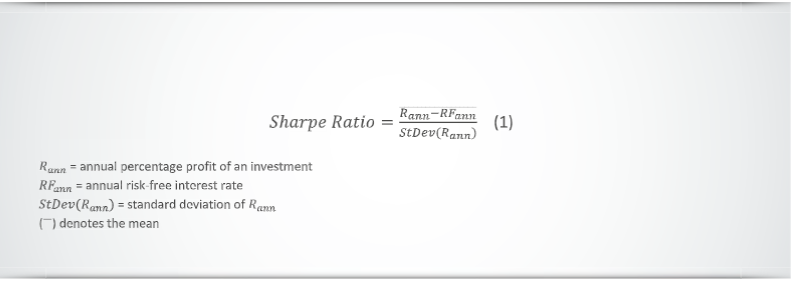
Calculation EXAMPLE:

If an investment has an average annual profit of 10%,
the annual risk-free interest rate is at 2% and
the standard deviation of annual profits is 5%
Sharpe Ratio = (10% - 2%) / 5% = 1.6

The higher the Sharpe Ratio the better the Reward/Risk for the investment.

NO DISTINCTION BETWEEN GOOD AND BAD VOL ATILITY

No matter how useful this formula is – there is a strong popular objection to the Sharpe Ratio as a global mean to gauge the risk-adjusted profitability of a trading system. The central point of this objection regards the use of standard deviation of all returns in the determination of risk: Using both positive and negative returns in the determination of risk, the Sharpe Ratio doesn’t separate “good” from “bad” volatility in performance although volatility which is generated by upward thrusts of the system’s profit curve is intuitively welcomed in contrast to volatility generated by downward thrusts of the curve. As shown in figure 1, the left profit curve, for example, is seen as riskier than the right one according to the way the Sharpe Ratio perceives risk although intuitively the left curve is much more appealing.

equity curve vs. Sharpe Ratio
Figure 2) Equity Curves vs. Sharpe Ratio
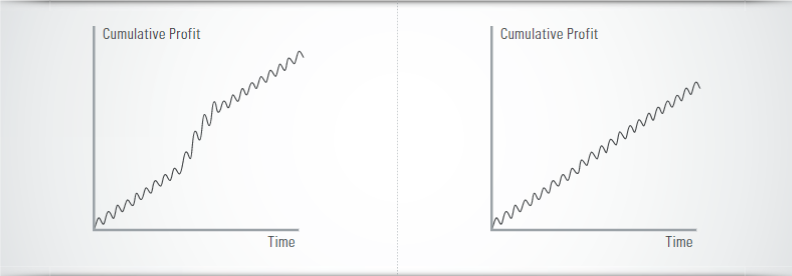
The Sharpe Ratio perceives risk as unpredictability of future performance not as possibility of losing money. Consequently, the left equity curve is seen as more risky by the Sharpe Ratio than the right one.

As a more sophisticated example, the Sharpe Ratio might see the same risk in a trend following type of system (which has many small loosing trades and a few amazingly profitable ones) and in a system which systematically shorts uncovered options thus having many small profitable trades and a few very large losses. The distribution of profits of the first system is usually positively skewed¹ whereas the second system has usually a negatively skewed distribution (see figure 2).

But perhaps in the second system there may be much more hidden risk of losing capital due to the possibility of black swan events (sudden extremely rare unfavorable situation for the system).

The Sharpe Ratio defines risk as deviation of returns above or below their mean
It appraises positively and negatively skewed distribution of returns the same way with respect to risk

¹ skewness is a measure of asymmetry for a distribution.

positive and negative skew
Figure 3) Positively skewed and negatively skewed performance distributions
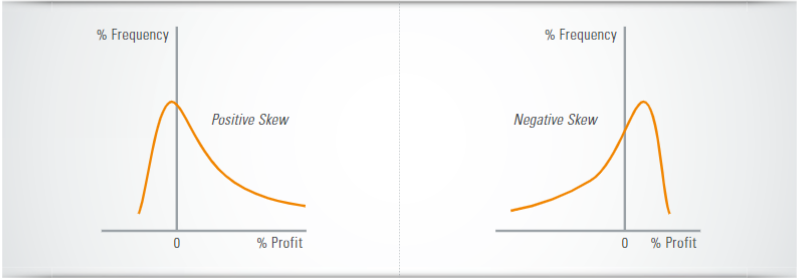
The Sharpe Ratio appraises positive and negative skews the same way.

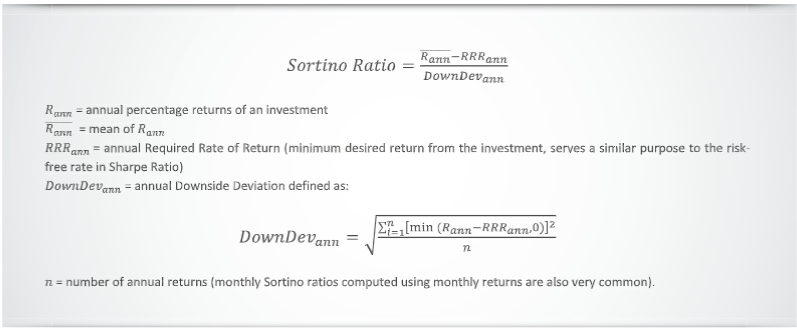
THE SORTINO RATIO – DOWNWARD VOLATILITY DEFINES THE RISK

An alternative Reward / Risk metric to the Sharpe Ratio is the Sortino Ratio which separates upward volatility from downward one and it uses the latter to represent the system‘s risk. The Sortino Ratio was created by Brian M. Rom in 1983 and it derives its name from Frank Sortino who advocated the use of only downside deviation from a desired minimum return as a proxy of risk. The typical discrete formula version of the annual Sortino Ratio commonly used is:

Sortino Ratio formula
Figure 4) Sortino Ratio formula

The Sortino Ratio perceives risk only as losses below a threshold and therefore it is focused on the risk of significant loss.
The Sortino Ratio regards risk as deviation of returns only below a desired threshold called “Required Rate of Return” (or “Target Return”)
It generally regards negatively skewed distribution of returns as more risky than the positively skewed ones

THE ANNUALIZATION METHOD POSES PROBLEMS

No matter if you use the Sharpe Ratio or the Sortino Ratio there are problems when it comes to annualization. When profits / losses for period other than yearly are given, a method known as the “square root rule” (multiplication by the square root of a number related to the period of returns) is usually applied to create the annualized Sharpe and Sortino ratios. For example, when daily equity curve for a system is used, an annualized Sharpe Ratio for the system could be:

Annualized Sharpe Ratio
Figure 5) Annualized Sharpe Ratio

The problem is that due to various issues (some profound and some hidden) this annualization method has very serious problems and it doesn‘t provide meaningful results. The annual Sharpe Ratio is usually way different from the annualized one provided by the square root rule. The same holds for the Sortino Ratio too. Annualization of both metrics therefore should be generally avoided.

SHARPE VS. SORTINO – WHICH GAUGE IS THE BETTER CHOICE?

What is a better Reward / Risk gauge to use when comparing trading systems? Well, even assuming that “risk” for you doesn’t just mean instability in performance but it means “risk of losing money”, the Sortino Ratio is not the definite answer to this question as the better gauge depends heavily on the systems’ goals and idiosyncrasy. Suppose for example that you want to gauge the Reward / Risk profile of a system whose goal is to earn relatively steady profits over time. This means that the system is designed to crunch short term price moves and it doesn‘t try to capitalize on extreme situations. As a consequence, any extremely profitable trade (although pleasant) is most probably attributed to good luck during for example a strong trend. Next time the same strong trend appears, the system may (due to bad luck, this time) have an opposite position thus producing a significant loss. In effect, high upside or downside volatility for the historical performance of this system is indicative of the system’s inability to stay away from extreme situations even though it is designed to avoid them. This is a case (and you will encounter many such cases when you perform optimization of a system’s parameters) where both high upside and high downside volatility in the historical performance of the system are not welcomed so the Sharpe Ratio is a better gauge of Reward / Risk than the Sortino Ratio for this system.

The Sharpe Ratio should be preferred when comparing the risk of systems that are designed to profit steadily from normal trading periods and don't try to capitalize on extreme situations

On the opposite, consider a system which targets strong swift directional trends of the underlying and tries to capture as much profit as it can from them. In this case it is only the downside volatility in performance which determines the true risk of losing money for the system because high upside volatility is exactly what the system is trying to achieve. So, the Sortino Ratio is a better gauge in this case.

The Sortino Ratio better suits to compare the risk of strategies which target high upside volatility of equity curve and more intense trading periods (like the trend following strategies).

CONCLUSION

This short explanation gave you the essential difference between the Sharpe and Sortino Ratio and it also gave you ideas regarding what to take into account before choosing the one ratio over the other to rank trading systems of the same character. When comparing systems of different characters perhaps the best you can do is to use both Sharpe and Sortino ratios to gauge the two faces of risk.

Would you like to use this article - in full or in part - for your purposes? Then please consider the following Creative Commons-Lizenz.